Master Options Trading with Gamma Exposure
Unlock market insights by understanding how dealer positioning can influence price movements. This guide will turn complex concepts into actionable trading knowledge.
Go to GEX TrackerWhat is Gamma Exposure (GEX)?
Gamma Exposure (GEX), also known as Gamma Levels, is a specialized metric that measures the change in delta exposure for options based on changes in the underlying price. It provides insight into potential market maker activities, helping traders anticipate market trends.
Function and Market Maker Hedging
GEX highlights important price levels where significant gamma exists due to market positioning and open interest.
- GEX reflects where market-makers and dealers may need to hedge to mitigate their risk.
- In simpler terms, it shows how much market makers and dealers will need to buy or sell of an underlying asset to hedge their positions as the price moves.
- This hedging, known as Delta Hedging, is a strategy market makers use to manage risks from price changes in underlying assets, maintaining balanced positions to ensure market stability and liquidity.
Interpreting GEX: The "Price Magnet" Analogy
GEX can be conceptualized as a gravitational pull on the stock price. The net GEX position dictates whether market maker activity will stabilize or accelerate price movements:
| GEX Condition | Market Effect | Dealer Action & Price Impact | Volatility |
|---|---|---|---|
| Positive GEX (Long Gamma) | Acts like a stabilizer or price magnet. Highlighted in green. | Dealers will buy as prices fall and sell as prices rise to hedge their positions. This creates support on the downside. | Low overall volatility. |
| Negative GEX (Short Gamma) | Acts like an accelerator. Highlighted in red. | Dealers will sell as prices fall and buy as prices rise. This amplifies price swings and can lead to accelerated moves to the downside. | Higher volatility. |
GEX theory suggests that the underlying asset tends to gravitate towards the strikes with the highest gamma exposure, which can act as a supply/resistance zone (calls) or a demand/support zone (puts).
Key GEX Levels and Quantification
- Zero Gamma Level (Gamma Flip Point): This is the tipping point where a change in the market's hedging dynamics can be signaled, shifting the environment from stable to volatile, or vice-versa.
- Data Calculation: GEX is calculated and updated throughout the trading day. By default, calculations are often based on a 1% move of the underlying security using gamma and open interest.
- Quantification Example: A GEX of $500M signifies that for every 1% move in the underlying stock, market makers would theoretically need to buy or sell $500 million worth of the stock to remain hedged.
- Formula Components: GEX is calculated by adding up all Call and Put Gamma at each strike level to present the net Gamma Exposure. The calculation of the total option's change in delta based on a 1% move can involve: Option's Gamma * Open Interest * Spot Price * Spot Price.
How to Use the GEX Tracker
Interpreting the Chart
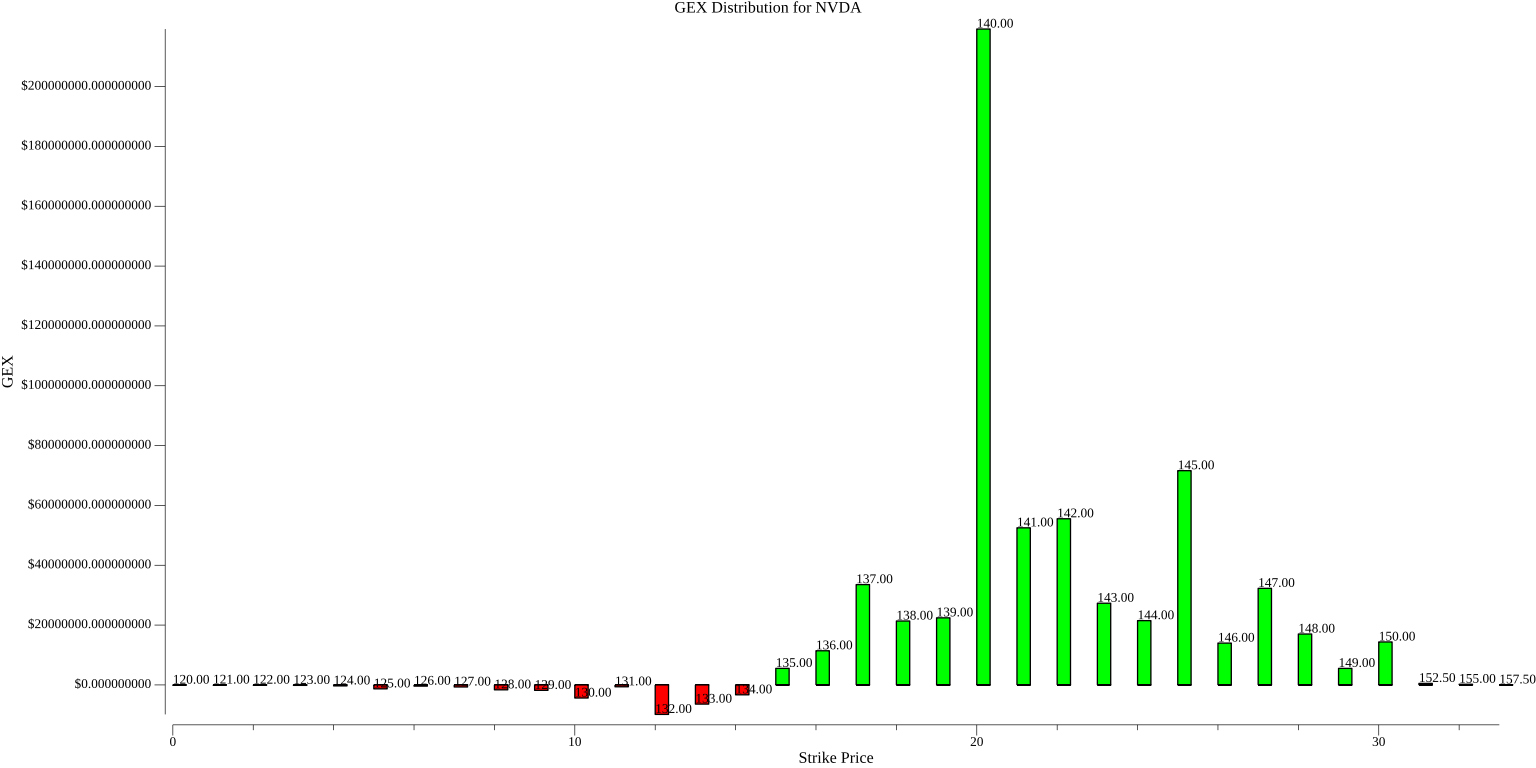
Our tracker visualizes these "magnet" levels for any given stock and expiration date. Here's how to read it:
- Large Green Bars (Positive Gamma): Indicate significant price levels where the price may become "sticky" and act as support or resistance.
- Large Red Bars (Negative Gamma): Highlight levels where a price breach could lead to accelerated, volatile moves.
- Zero Gamma Level: This is the tipping point. A cross above or below this level can signal a shift in the market's hedging dynamics from stable to volatile, or vice-versa.